Microsoft Azure is a powerful platform on which you can build your IoT application. We look at how Libelium IoT sensors, Azure IoT Hub and PowerBI can be used to monitor air quality in several easy steps. Data such as pH, ORP and temperature are collected, transmitted using 4G then processed and visualised using Microsoft Azure, Azure SQL and PowerBI.
1 – IoT Water Quality Sensors
We will be using the Libelium Plug & Sense Smart Water Pro 4G. This device has six sensor sockets which support a wide range of measurements including dozens of water ions (i.e. sodium, magnesium, etc.), pH, depth, flow, temperature, ORP and conductivity. For more advanced applications; items such as fluorescein, organic matter, blue/green algae and turbidity can be measured. To see a comprehensive list of sensors supported – please view the following article.
For this application – we will be monitoring pH, Water Temperature and Oxygen Reduction Potential (ORP) – common measurements in Smart Water applications. The sensors are connected to the unit, 4G SIM inserted, and the small auxiliary solar panel connected. Turbidity measurement with IoT is also a very common application.
The Plug&Sense includes a battery and a solar panel for mains-free applications. For other deployments in the northern hemisphere where sunlight is relatively limited – we complement the solution with a 12V marine battery, larger panel and a solar charge regulator. The regular features a 5V output that keeps the Plug&Sense powered all year-round.
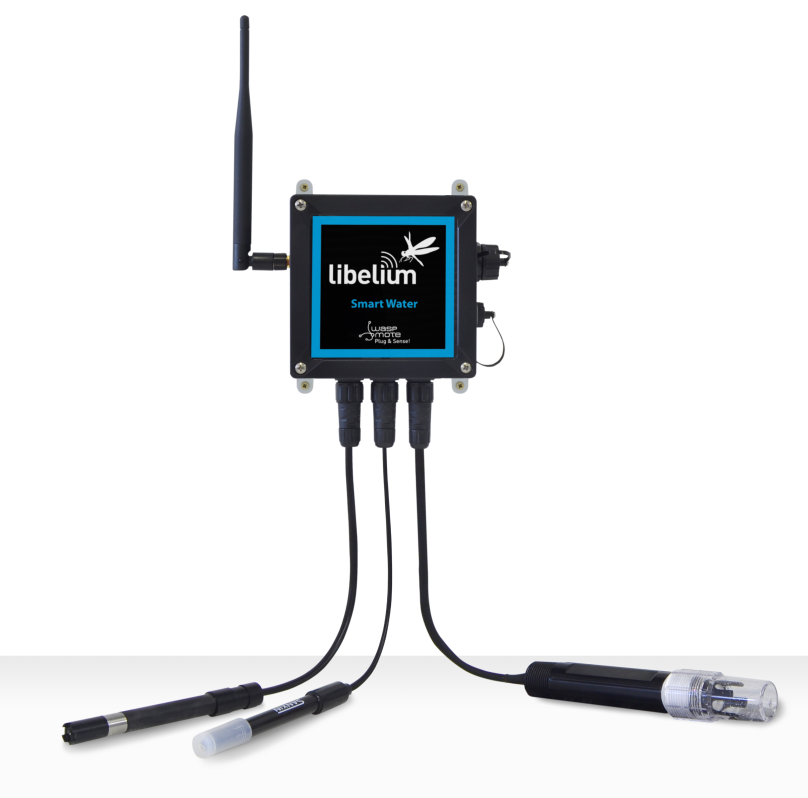 The Libelium Plug & Sense Smart Water has dozens of sensors to detect chemicals, turbidity and the presence of metals.
2 – Code
The code used by the Plug&Sense is ‘C’ – but with dozens of code samples available online. Libelium also has a programming toolset that generates the code for you; based on the sensors used, frequency of measurement and the comms platform (i.e. LoRa, 4G, Zigbee, WIFI).
The Manx Technology Group IoT teams feature technical, cloud, network and software experts, who can assist with the entire lifecycle of an IoT project. Whether you are an end-user or systems integrator, we can assist with the design and programming of your deployment. This expertise not only includes Libelium but extends to Microsoft Azure, .NET and SQL platforms.
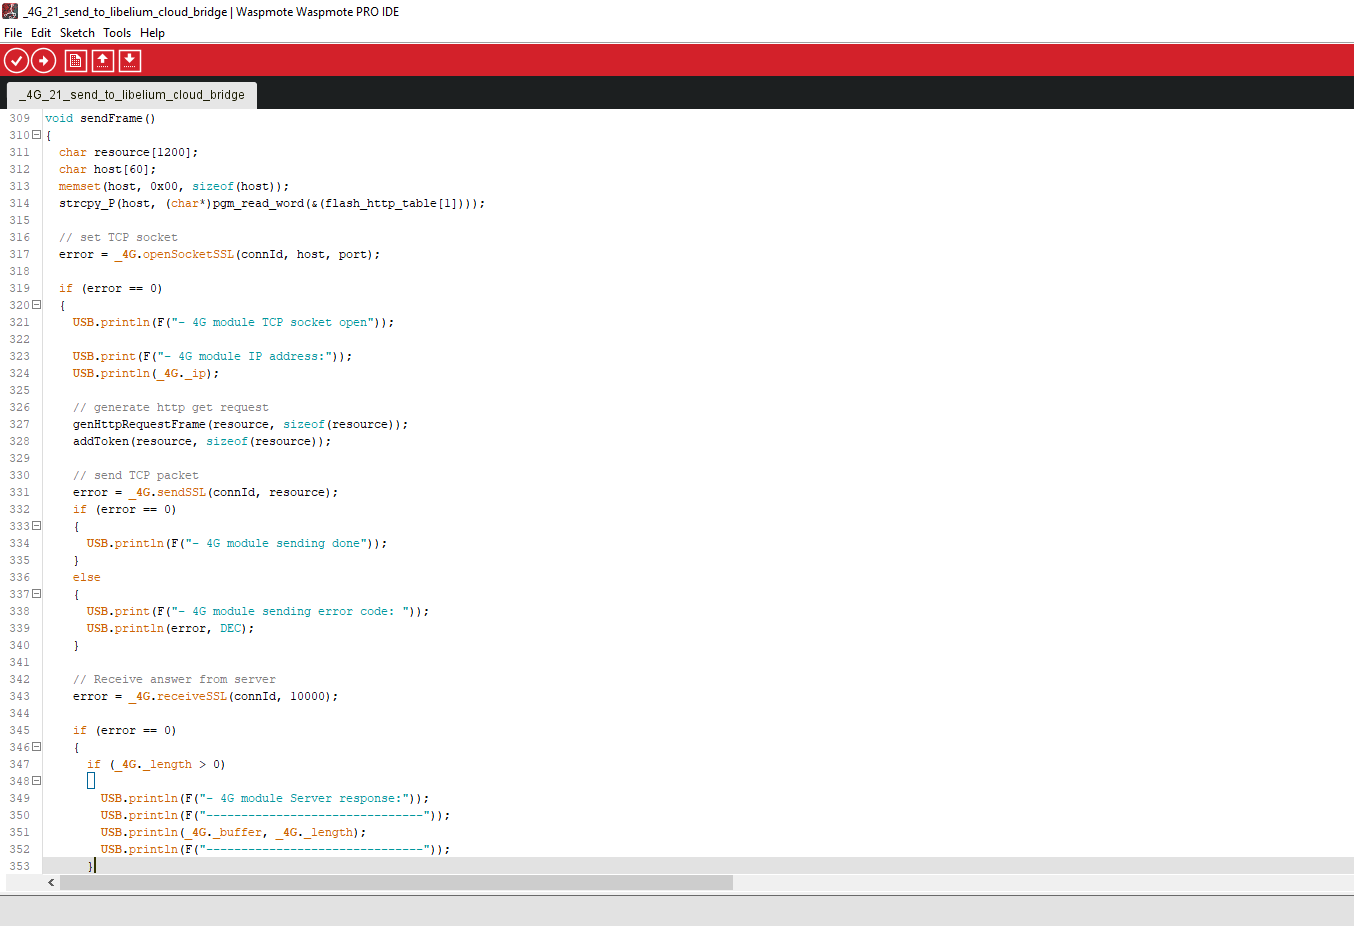 This code example is sending a frame of data over an SSL transport using 4G. The frame contains sensor data relating to air and water quality.
3 – Libelium Cloud Bridge
To reduce the complexity of an IoT project and to accelerate time-to-market, the use of Libelium’s Cloud Bridge platform is recommended. Cloud Bridge is a middleware platform that receives data from your IoT sensors and allows you to send this data to a wide range of leading Cloud and PaaS (Platform as a Service) providers.
For our deployment, we will be using Microsoft Azure IoT Hub – but Cloud Bridge also supports Alibaba Cloud, Azure Event Hubs, AWS, IBM BlueMix and many more. When you purchase a device from Libelium – the serial number can be registered with Cloud Bridge – ready for receiving data.
Technical Overview of Libelium Cloud Bridge
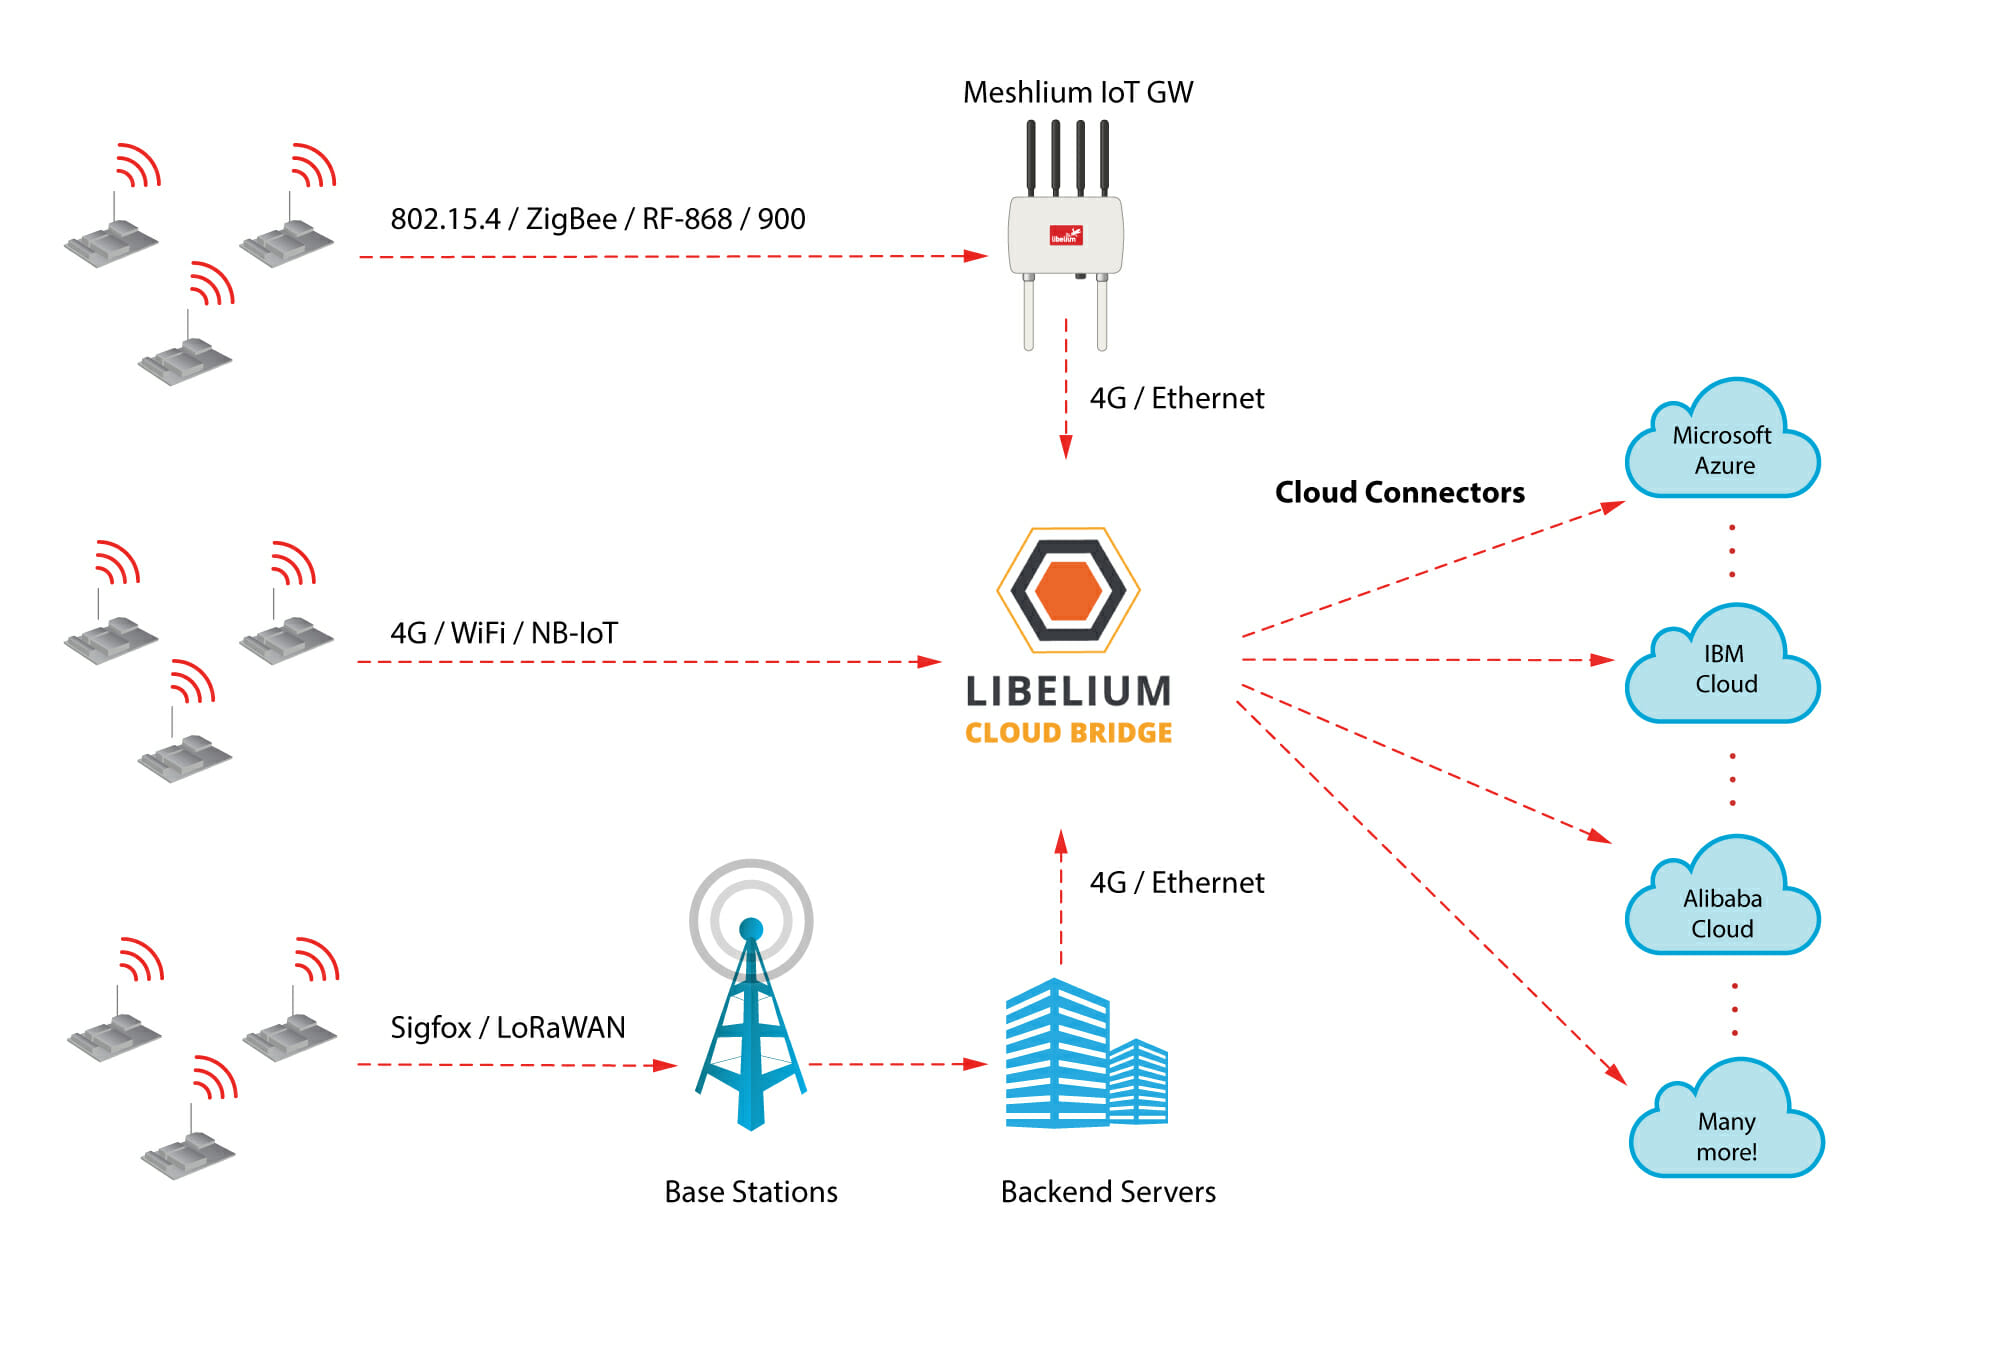 Cloud Bridge – Technical overview. Data received via 802.15.4, 4G, WIFI and Sigfox. The data is processed by the platform before being forwarded to your choice of IoT platform. Data is encrypted end-to-end.
Adding a Libelium Cloud Bridge Connector
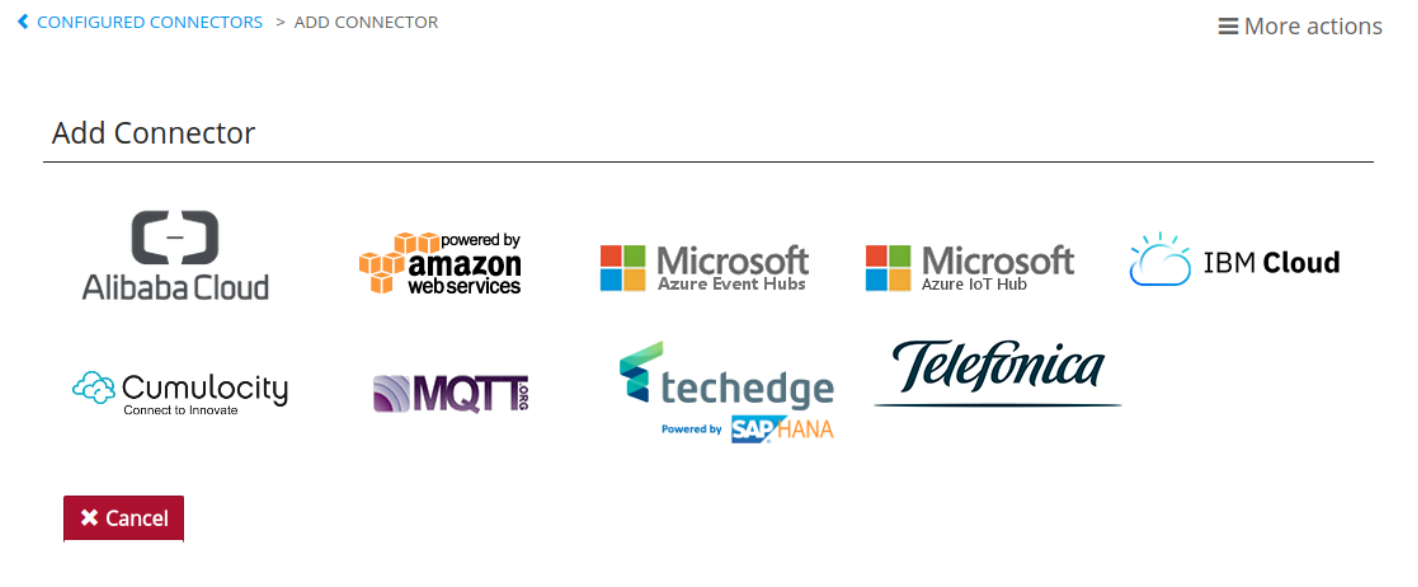 Cloud Bridge: Adding a connector to a PaaS/Cloud platform
In our example, we will be using Microsoft Azure IoT Hub to receive and process data. The detailed configuration of Libelium Cloud Bridge and Microsoft Azure is outside the scope of this article, but documentation is available for Libelium here and Microsoft here.
4 – Azure IoT Hub
Azure IoT Hub is configured to accept events from Cloud Bridge and the devices. We then have a choice to use a Function App or Microsoft Stream Analytics. Microsoft Stream Analytics enables us to do real-time reporting but for this example, we will use a small Function App that takes input from an IoT Hub Event before writing the data to a small Azure SQL Instance.
Creating an Azure IoT Hub
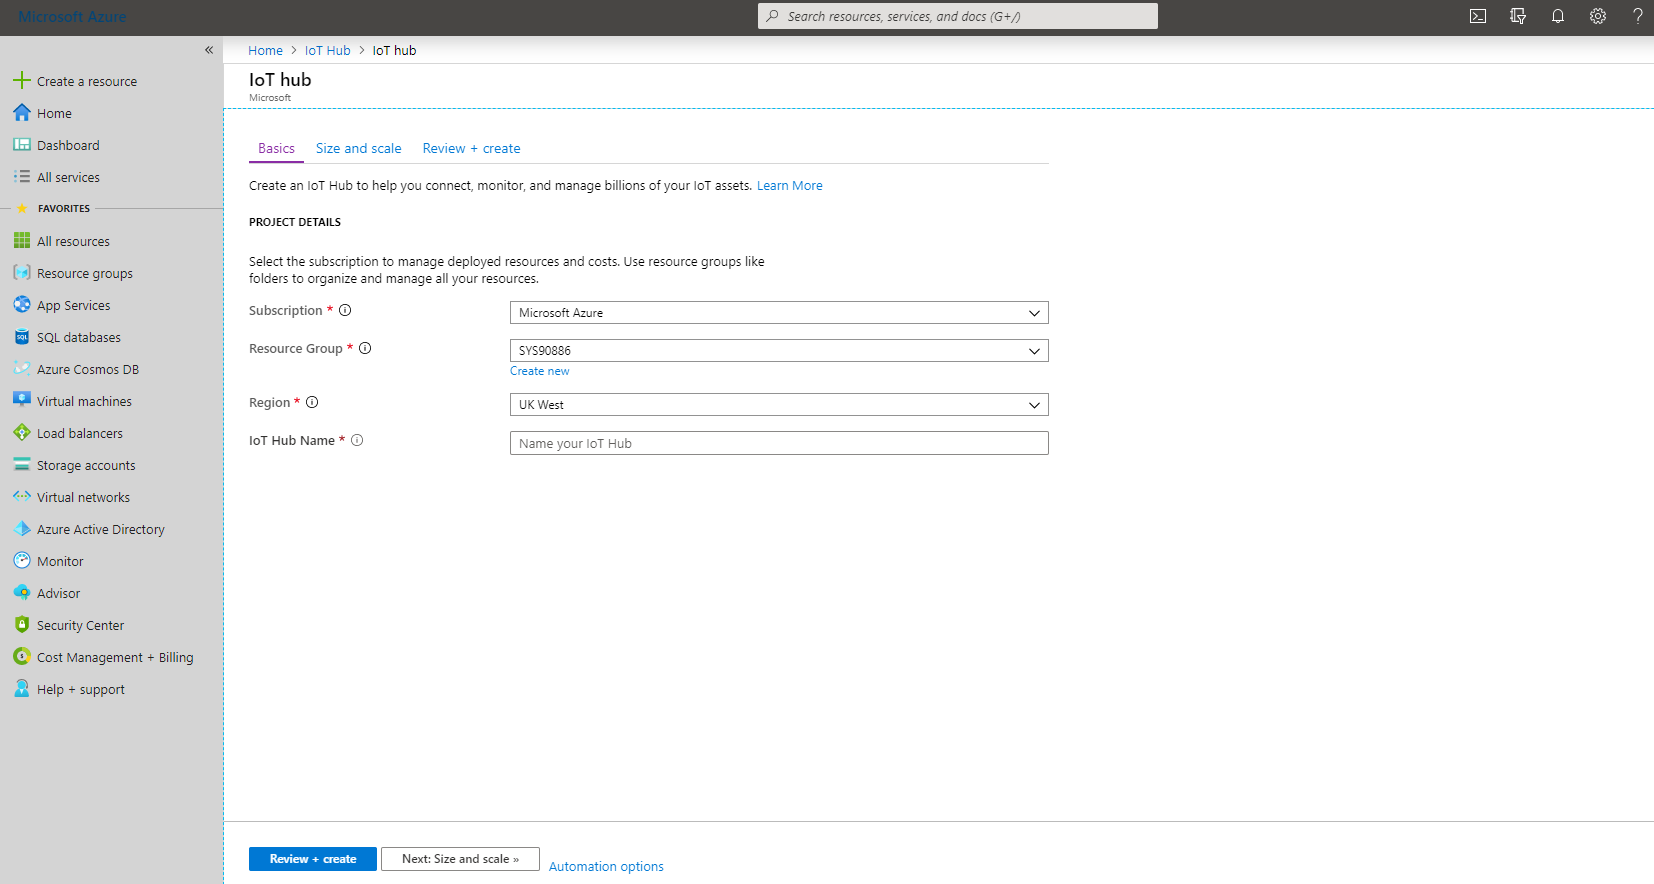 Creating an Azure IoT Hub instance from within Microsoft Azure
Function App
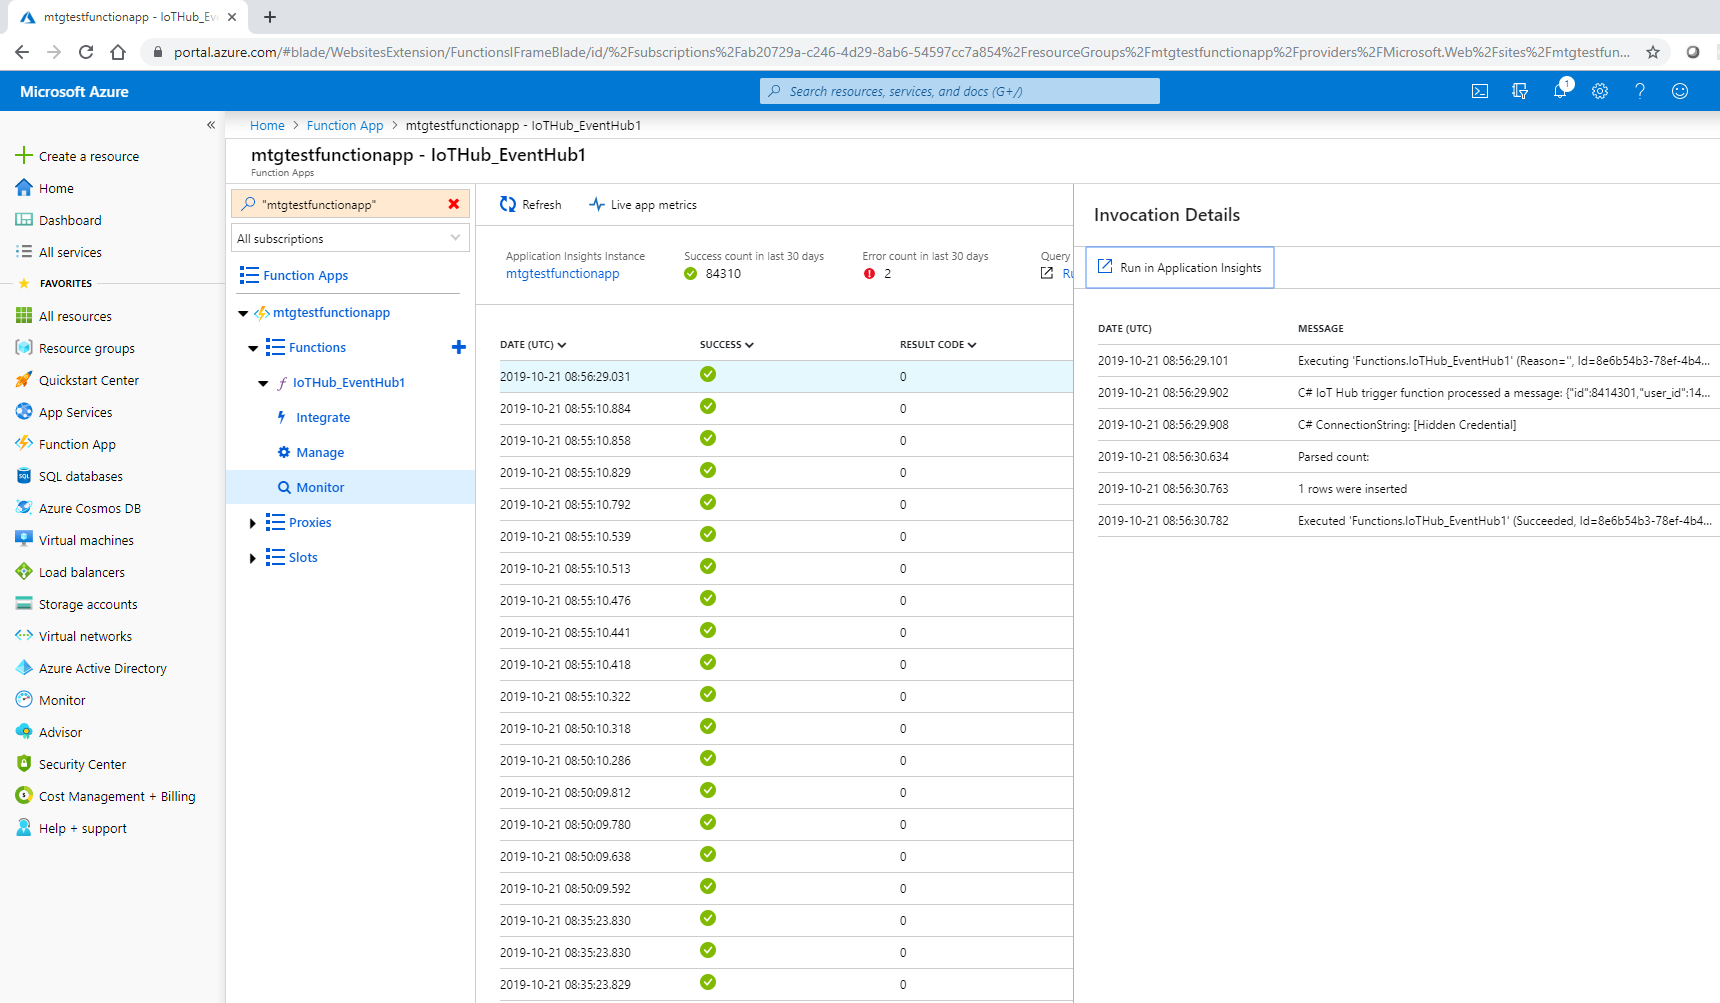 Azure IoT Event Hub – showing data being received from devices and the Function App functionality.
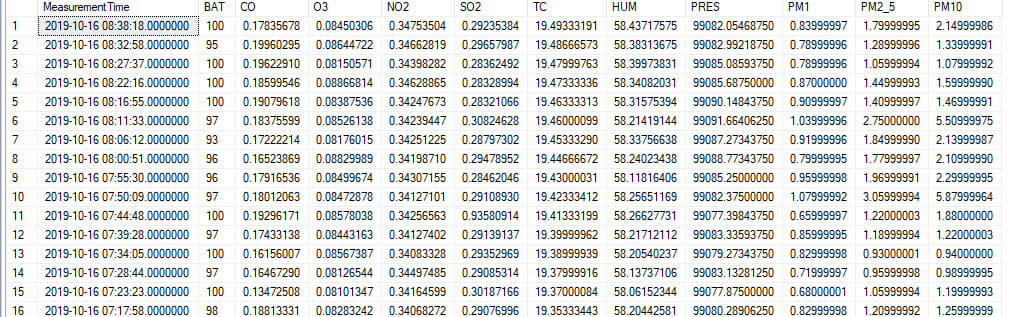
Sample IoT data in Azure SQL
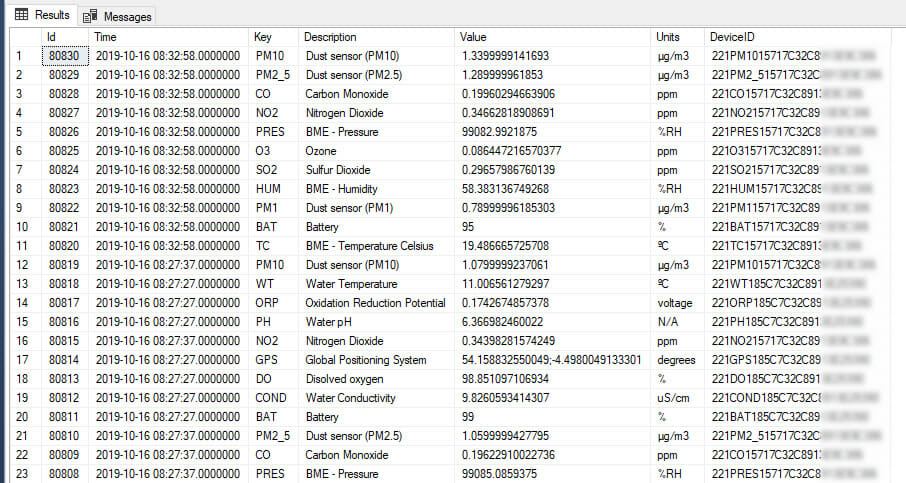 Sample data in Azure SQL. You can see measurements for air quality and water quality. This data is received by Azure IoT Hub before a Function App adds to the data to Azure SQL.
Processed IoT data in Azure SQL
With some clever T-SQL, we turn this data into a more structured, useful format for analysis in Power BI. This example features air quality indicators (rather than water) but it gives you a sense of how easy it will be to visualise and trend this data.
 Azure SQL – Structured air quality data for analysis
5 – Visualising Water Quality data with Power BI
Now that the data is in Azure SQL – we can easily visualise the data in Microsoft Power BI. Available as a subscription service from a Microsoft Cloud Partner (such as MTG!) – the web-based application makes it easy for anyone to build powerful dashboards and visualisations.
The following image shows a dashboard of Water pH, ORP, Dissolved Oxygen, Conductivity and Temperature. This is data is accessible from desktop, browser and tablet/mobile apps in real-time.
 Smart Water – Power BI Visualisation. The charts show Water pH, ORP (Oxygen Reduction Potential), Dissolved Oxygen, Conductivity and Water Temperature. The final chart is the battery charge.
